INV-01 TSA 23 Validation and Gap Analysis
This guide records the first independent-ish checks of the TSA 23 inventory pilot: a VRI screening comparison and a priority map of point-cloud tiles omitted from the full run. Neither check turns the pilot into an operational inventory.
VRI screening
The VRI file is the TSA 23 checkpoint used by the instance
(ria_vri_vclr1p_checkpoint8.feather, 102,132 polygons, EPSG:3005). Cell
centres are transformed from EPSG:3157, joined by point-in-polygon, and compared
at cell and VRI-polygon level.
VRI is an interpreted polygon inventory, not independent field data. Its
PROJ_HEIGHT_1 is projected/top height rather than Lorey height, and
LIVE_STAND_VOLUME_125 is live volume for trees >= 12.5 cm rather than FEMIC
gross volume. The comparison is a screening check, not an accuracy estimate.
Attribute |
Cells |
Model mean |
VRI mean |
Bias |
RMSE |
r |
|---|---|---|---|---|---|---|
Lorey height (m) |
5,670,064 |
16.18 |
18.66 |
-2.48 |
7.65 |
0.398 |
Basal area (m2/ha) |
2,745,339 |
24.07 |
19.46 |
+4.61 |
11.49 |
0.364 |
Gross volume (m3/ha) |
2,711,451 |
141.57 |
112.11 |
+29.46 |
92.83 |
0.397 |
The pattern is compression: low-biomass VRI stands are overpredicted and high-biomass stands are underpredicted. IDF BA and volume are overpredicted; ESSF is underpredicted. The disagreement is much larger than the pilot LOOCV errors (height 0.688 m, BA 4.414 m2/ha, volume 20.666 m3/ha).
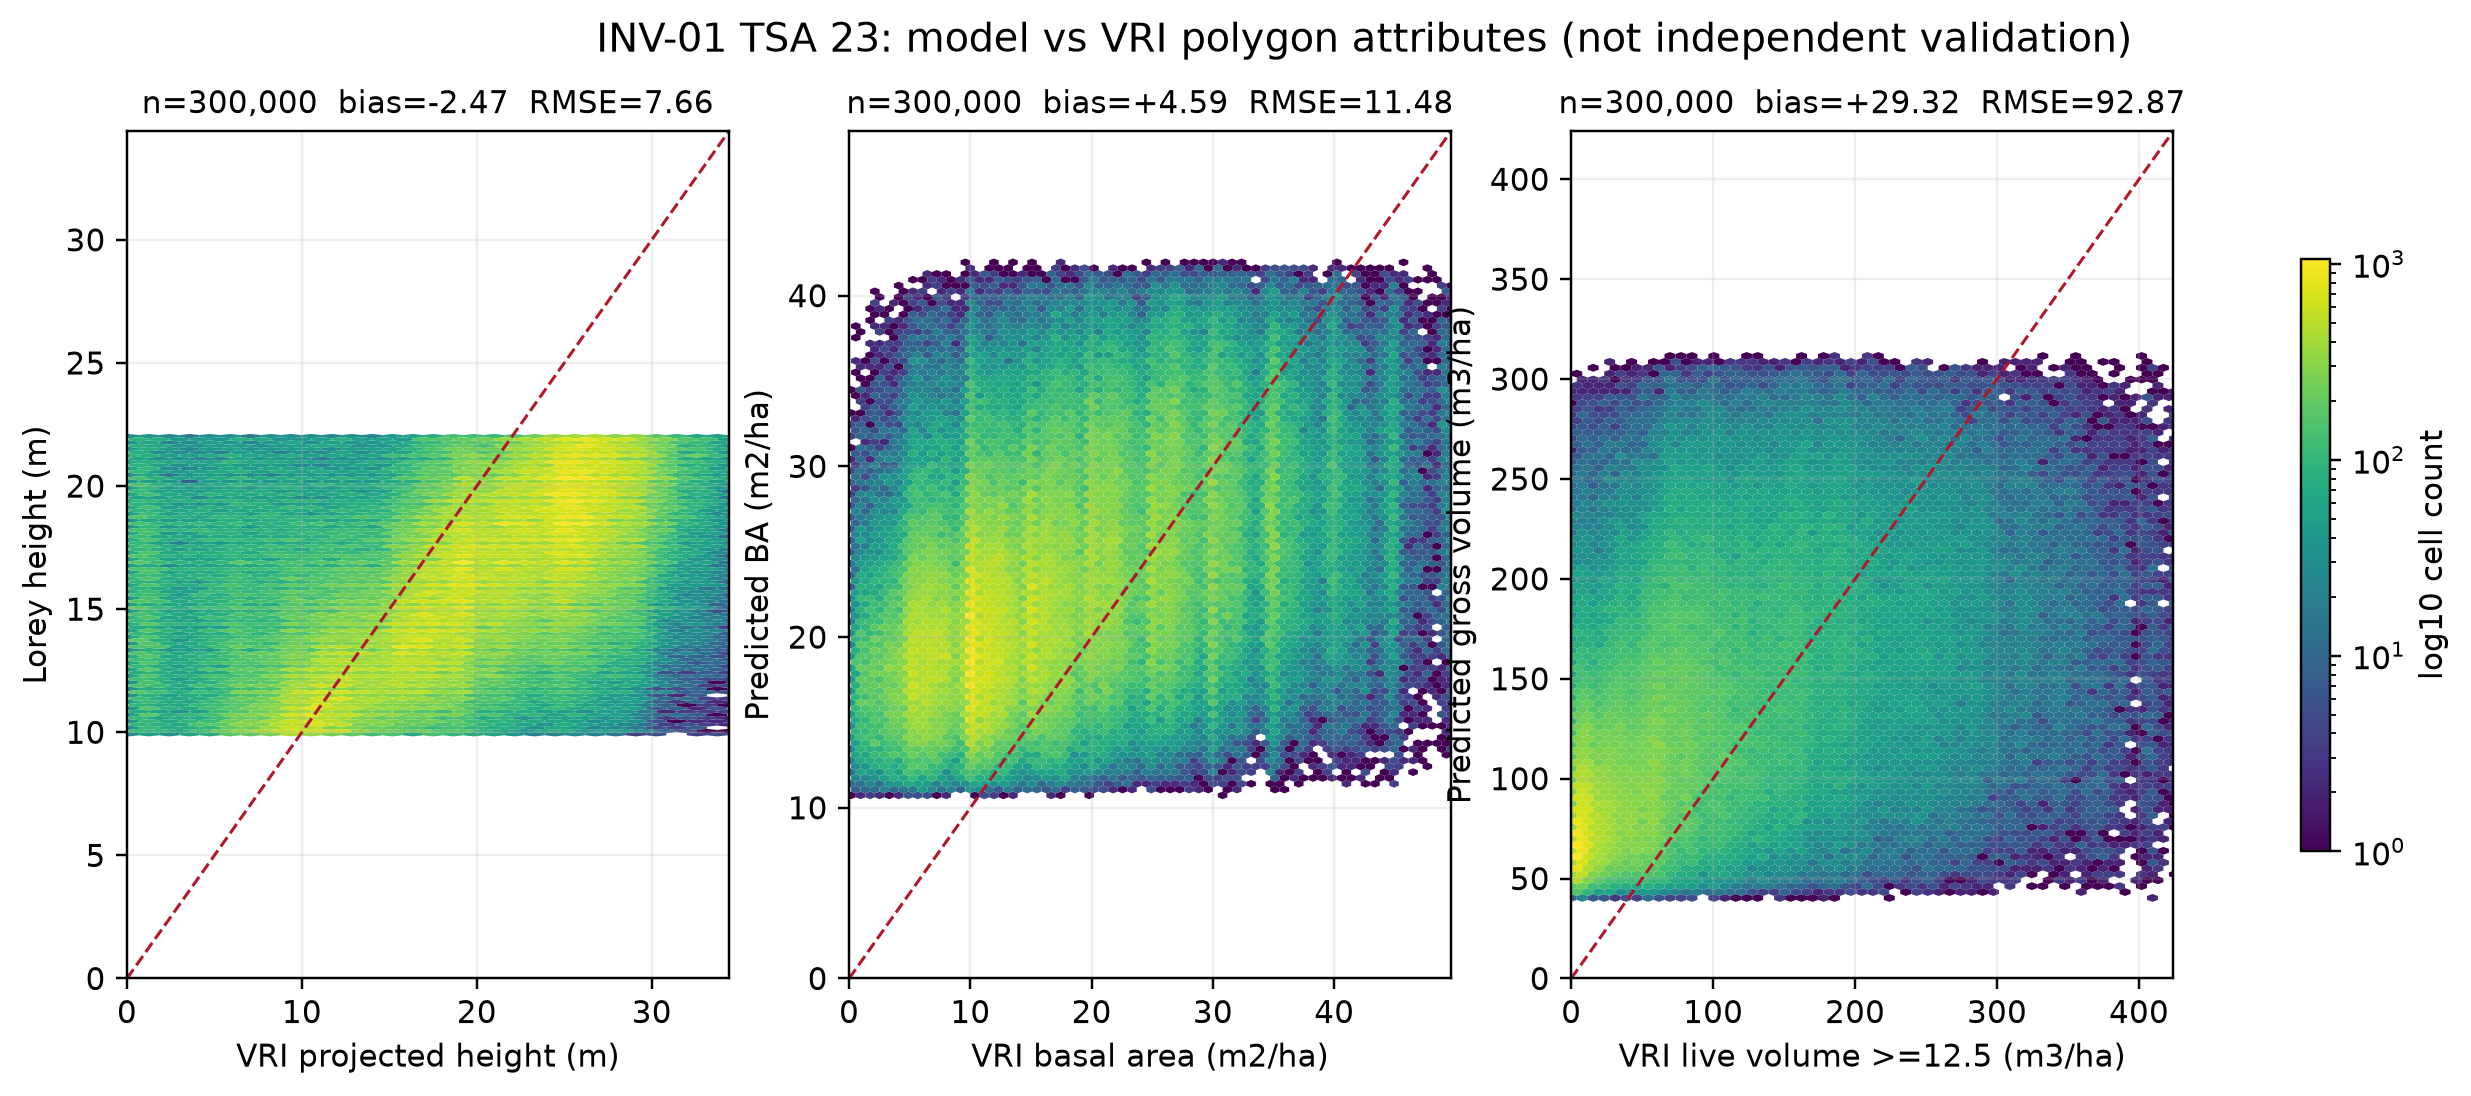
Model predictions versus VRI polygon attributes. The red line is 1:1.
The full tables and method are in
notes/reports/inv01-tsa23-vri-reconciliation.md.
PSP holdout: use the archive now
The 14-plot calibration is a subset of the public FAIB PSP archive. The archive
contains 7,341 sites province-wide, 200 in TSA 23, 162 of them in IDF. TSA 23
has 455 visits; 22 visits since 2017 have a LidarBC point cloud, 18 are in the
processed tiles, and four more are in the omitted tile lidarbc:4:117213.
Those four omitted IDF plots (2018 measurements, 2019 point cloud) are a real held-out set. We processed them with the 2019 layer-6 1 m DEM and the same first-return protocol. They were not used in the 14-plot fit:
Attribute |
Observed mean |
Predicted mean |
Bias |
MAE |
RMSE |
|---|---|---|---|---|---|
Lorey height (m) |
19.87 |
20.87 |
+1.00 |
1.07 |
1.46 |
Basal area (m2/ha) |
36.61 |
37.55 |
+0.93 |
6.97 |
8.35 |
Gross volume (m3/ha) |
263.71 |
352.97 |
+89.27 |
97.64 |
118.21 |
The four plots are high-biomass IDF stands. Three of four are outside the BA/volume Lhmean range (5.8017-14.1882 m), and one is outside the height Lhp95 range (9.508-24.07 m), so these are extrapolations, not an in-domain validation. The full-run map already drops cells outside those ranges, so these plots would be unmapped. The result still matters: the cards do not cover a large part of the high-biomass IDF.
A simple refit on the same 18 plots did not improve tile-level CV. More high-biomass IDF plots with LidarBC support are needed before replacing the cards. The four plots are clustered in one tile, so this is not a TSA-wide spatial validation, but it is enough to reject waiting as the next step.
The fifth candidate, 4025421, has its plot support outside the actual point
cloud extent and is excluded. The full evidence, including the applicability
flags and exploratory refit, is in
notes/reports/inv01-tsa23-psp-holdout.md. The high-biomass target set is
recorded in notes/reports/inv01-tsa23-high-biomass-targets.md.
Model-status mask
The current 25 m products are only valid on part of the TSA. The companion status raster separates coverage gaps from model-domain gaps:
Class |
Area km2 |
Share |
|---|---|---|
No public point cloud |
2,465.7 |
20.0% |
Omitted / no fine 1 m DEM |
1,936.7 |
15.7% |
Processed, no model cell |
3,643.0 |
29.5% |
Height only |
2,463.5 |
20.0% |
BA/volume valid |
1,839.2 |
14.9% |
Only 14.9% of TSA 23 has BA/volume predictions; height covers 33.3%. Do not
read classes 0-3 as zero biomass. The three-band status raster is described in
notes/reports/inv01-tsa23-model-status.md.
Applying the experimental regional BA/volume cards raises joint BA/volume coverage to 23.6%:
Class |
Area km2 |
Share |
|---|---|---|
No public point cloud |
2,465.7 |
20.0% |
Omitted / no fine 1 m DEM |
1,936.7 |
15.7% |
Processed, no model cell |
3,207.1 |
26.0% |
Height only |
1,825.5 |
14.8% |
BA/volume valid |
2,913.0 |
23.6% |
The candidate adds 1,074 km2 of BA/volume coverage but is still experimental.
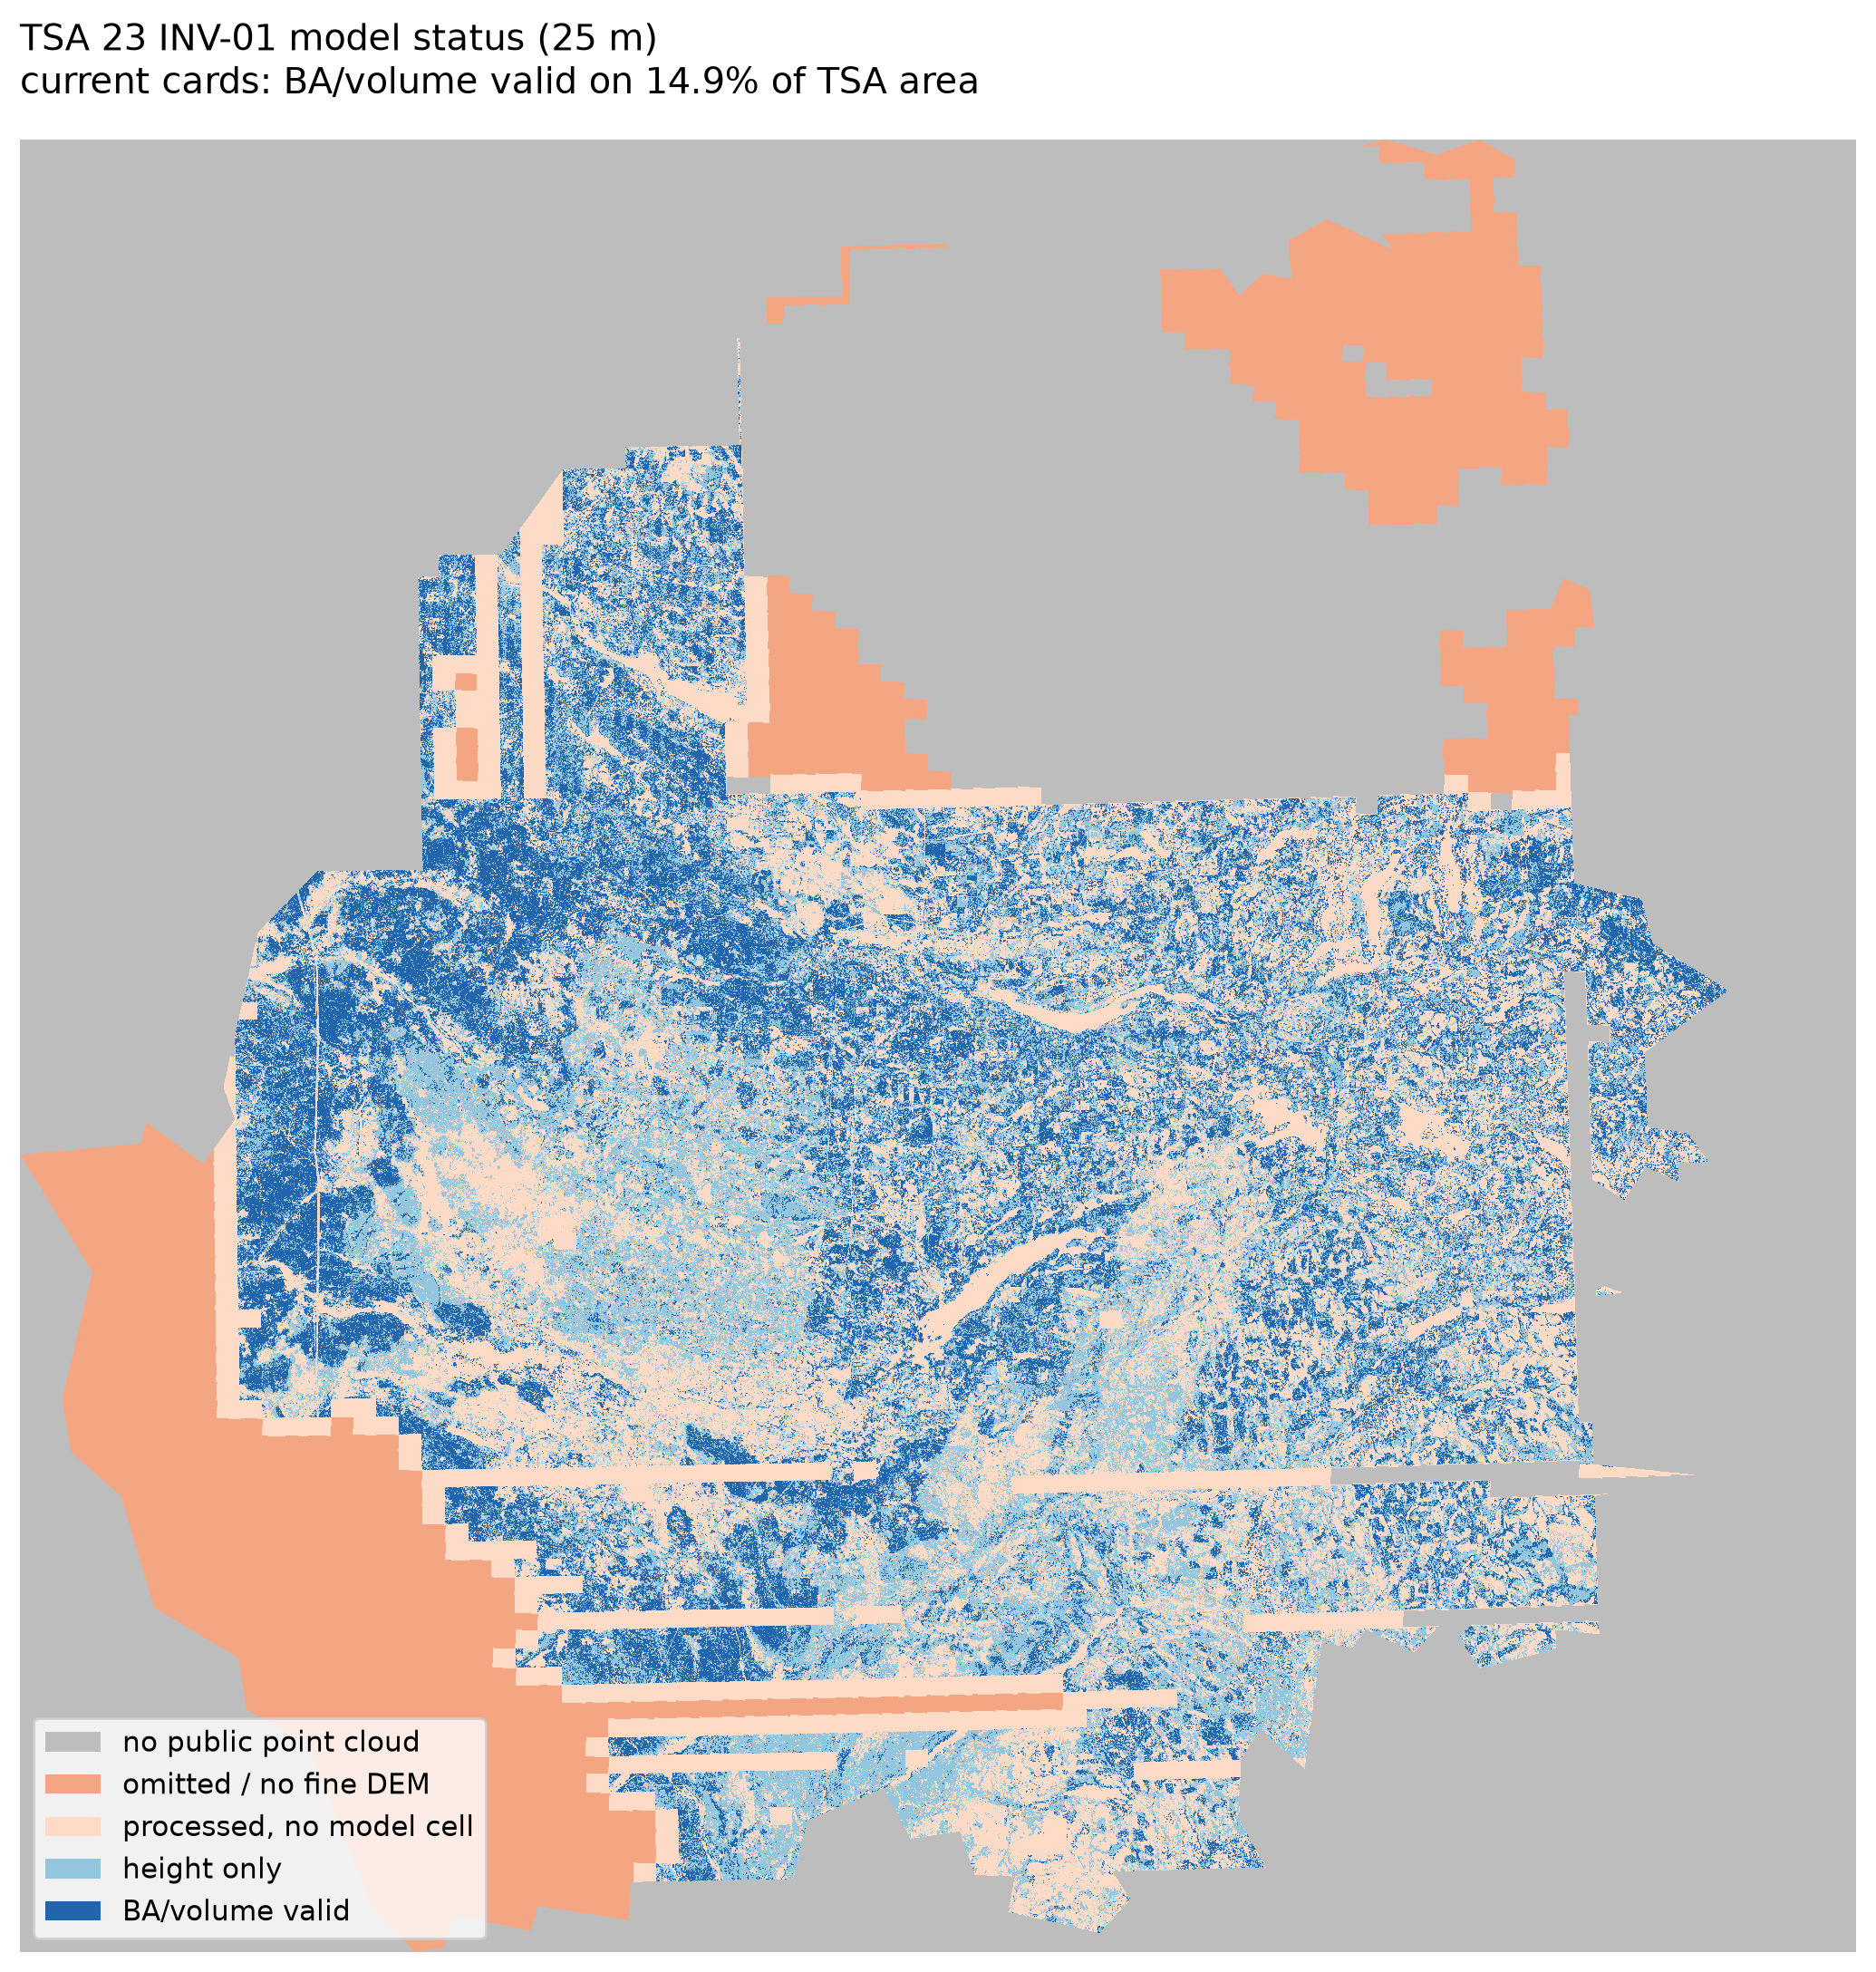
Current pilot model-status mask. BA/volume are valid on 14.9% of the TSA.
Regional calibration using the full open-data stack
The full open-data audit found 46 high-biomass IDF PSP plots across BC with matching LidarBC point clouds, not just TSA 23/29. Twenty-four produced usable features; 19 non-TSA-23 plots supplement the 14 TSA 23 training plots.
The regional high-biomass set fixes the volume extrapolation on the four TSA 23
plots and improves BA (RMSE 8.351 -> 6.670), but height gets worse. The BA and
volume candidates are experimental; the current height card stays. A
leave-one-TSA-out check is mixed (volume RMSE 16-101 m3/ha across regions), so
the cards are packaged as an experimental model bundle, not operational cards.
Details: notes/reports/inv01-tsa23-regional-calibration.md and
experiments/inv01-regional-calibration/model_bundle/.
A second-order polynomial volume model improves leave-one-TSA-out average RMSE
to about 35.5-40.3 m3/ha, but the four-plot TSA 23 external RMSE stays around
42. It is packaged as a term-based card under
experiments/inv01-regional-calibration/hybrid_bundle/nonlinear/model.json.
The combined hybrid bundle is
experiments/inv01-regional-calibration/hybrid_bundle/: linear BA plus the
term-based nonlinear volume card plus the current height card. Its paired
external check is BA RMSE 6.670 and volume RMSE 42.092; cross-region volume RMSE
ranges from 3.6 to 67.1 m3/ha. The standard femic lidar inventory path
reproduces the script-generated BA and volume surfaces, and a config-driven
rerun with --model-key is byte-identical; see
notes/reports/inv01-tsa23-cli-parity.md. The hybrid surface is a
research-only experimental root, not the instance default. It raises joint
BA/volume coverage from 14.9% to 23.6%; current/hybrid overlap differences are
BA RMSE 4.66 m2/ha and volume RMSE 12.45 m3/ha. Published cards stay unchanged
and the hybrid remains non-operational. A leave-one-TSA23-tile-out check gives
BA RMSE 6.188 m2/ha and volume RMSE 25.473 m3/ha across 18 plots; see
notes/reports/inv01-tsa23-hybrid-vs-current.md and
notes/reports/inv01-tsa23-spatial-holdout.md.
The instance default config is BA only. Height is withheld after independent
validation gave strict RMSE 2.54 m (19 in-range plots) and TSA 23 strict RMSE
4.18 m (6 plots), versus the 0.688 m pilot LOOCV. Volume is withheld because
the strict independent volume error is 67.02 m3/ha and the time-aware TSA 23
volume error is 93.86 m3/ha. Both remain available through the experimental
config or an explicit card path. See
notes/reports/inv01-tsa23-height-validation.md.
The BA-only pilot release is documented in
notes/reports/inv01-tsa23-ba-pilot-release.md with the manifest at
metadata/inv01/tsa23_ba_pilot_manifest.json. It has 2,942,755 rows and
pixels, 14.9% TSA BA coverage, and is explicitly non-operational. The
acceptance check is in
notes/reports/inv01-tsa23-ba-pilot-acceptance.md: the product is accepted as
experimental and rejected for operational use; VRI/THLB coverage is not inferred
because those instance geometry layers are not materialized.
A larger independent BC IDF check is less optimistic. 969 latest IDF PSP
plots exist; 573 have LidarBC point-cloud and DEM coverage, and 111 have ground
measurements within five years. 88 plots yield usable features; 70 stay within
five years, while 18 used 6-11 year fallback tiles. The strict independent set
is 38 plots, with BA RMSE 8.86 m2/ha (36 in range) and volume RMSE 67.02 m3/ha
(28 in range). The 56-plot expanded set is 8.02 and 62.93. The seven
independent TSA 23 plots give BA RMSE 15.02; no independent TSA 23 volume plot
is inside the predictor range. The four-plot high-biomass check was therefore
not representative. See notes/reports/inv01-tsa23-bc-validation.md.
A 435-plot time-lag sensitivity adds the older covered plots. Volume error
rises from 67.02 m3/ha at 0-5 years to 99.06 at 21-30 years and 116.44 beyond
30 years; this is sensitivity evidence, not current-condition validation. A
time-aware refit on 431 development plots improves pooled strict-test error
(BA 7.92, volume 62.67) but is worse on TSA 23 (BA 11.50, volume 93.86); it is
not promoted. See notes/reports/inv01-tsa23-time-lag.md and
notes/reports/inv01-tsa23-time-aware-refit.md.
A refit experiment selected candidates by leave-one-TSA-out CV on 31
development plots. The selected BA form does not improve on the fixed hybrid
(8.05 vs 7.93 all independent rows; 8.10 vs 8.02 in-domain). The selected
volume form improves independent in-domain RMSE from 62.93 to 52.06 m3/ha (42
rows), but no independent TSA 23 volume plot is inside its range and 52 m3/ha is
still too large for an operational product. Neither refit is promoted; keep
abstention outside the development ranges. See
notes/reports/inv01-tsa23-refit-applicability.md.
Omitted-tile gap
Of 6,806 TSA-intersecting point-cloud tiles, 5,899 were processed and 907 were omitted because they have no matching fine 2.5 km, 1 m DEM tile. The 907 tiles cover 1,962 km2 inside TSA 23 (15.9%), including 1,778 km2 of VRI forest and 861 km2 of VRI THLB.
All 907 have some DEM candidate, usually a larger 1:20000 layer 6 tile; they do not have the same fine layer 5 tile used by the run. A separate layer 6 experiment would be needed to fill them.
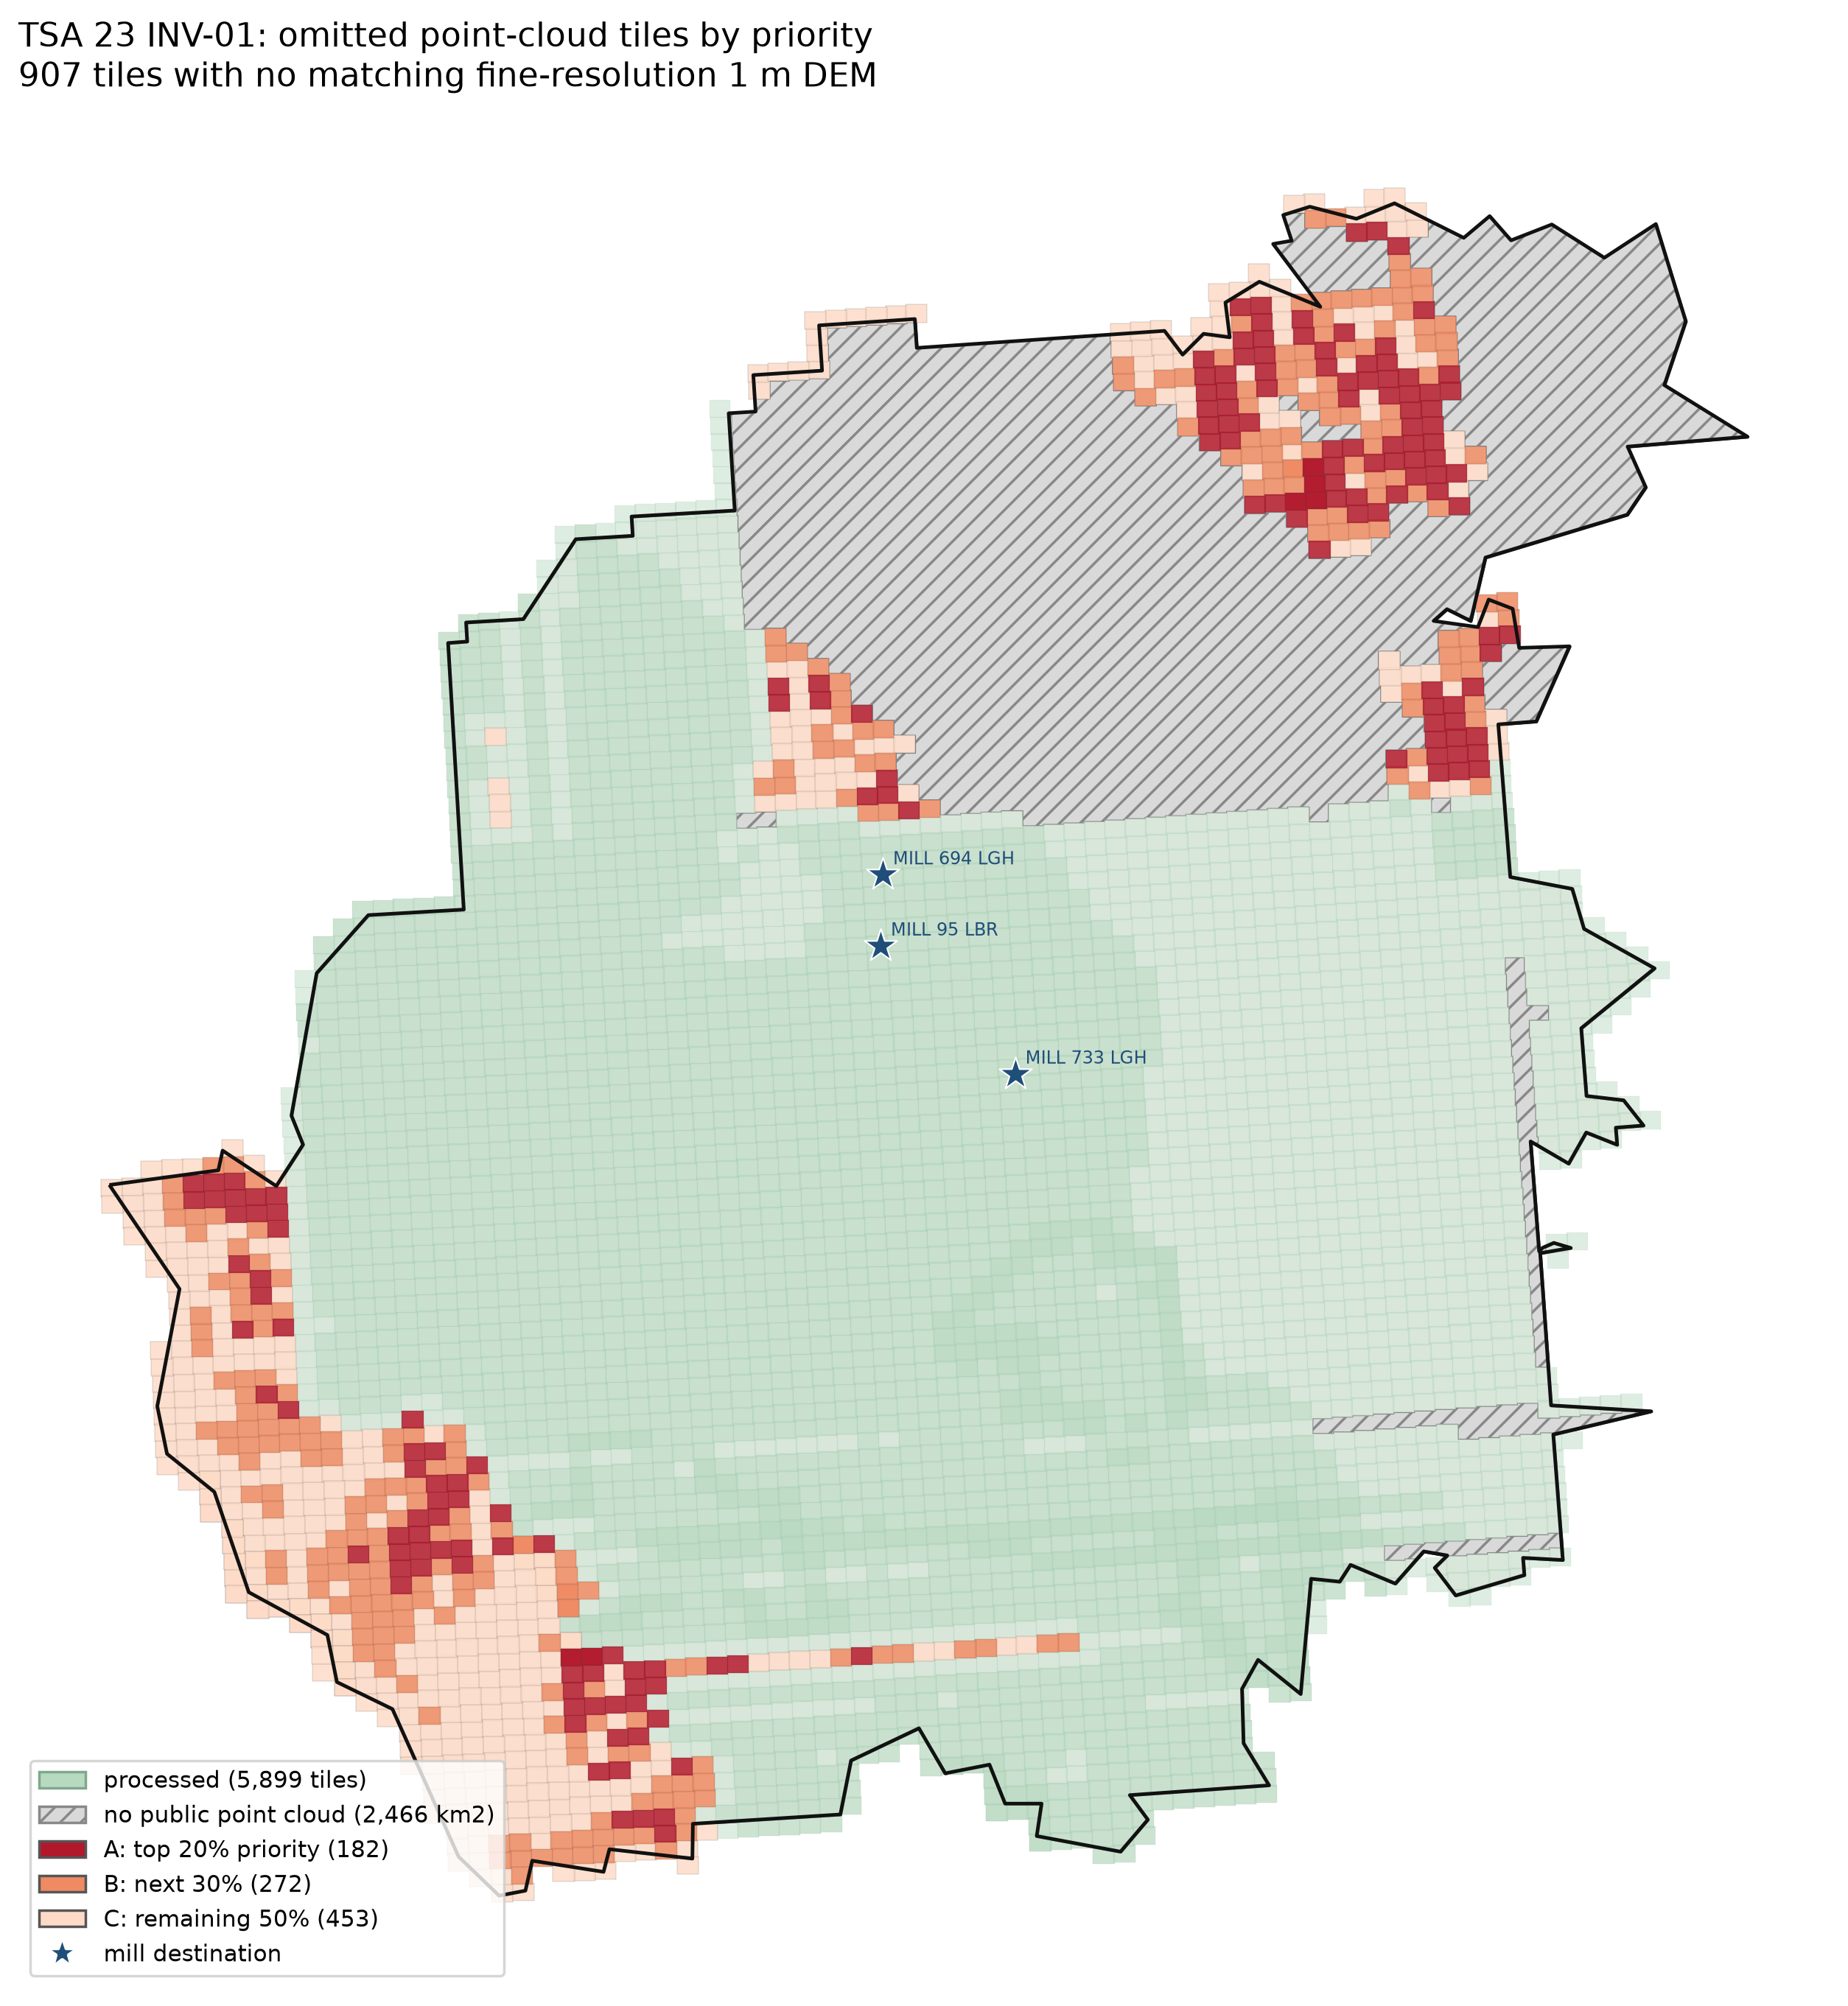
Omitted tiles by priority. Grey hatched areas have no public point cloud in the current selection.
Coverage arithmetic:
Item |
Area |
|---|---|
TSA 23 |
12,353.2 km2 |
Processed footprint inside TSA |
7,949.0 km2 (64.3%) |
All selected point clouds inside TSA |
9,886.7 km2 (80.0%) |
No public point cloud |
2,466.5 km2 (20.0%) |
Omitted 907 tiles inside TSA |
1,962.0 km2 (15.9%) |
The priority score is a heuristic combining VRI forest area, THLB area, distance
to the nearest c5 network vertex, and distance to the nearest mill. It is not an
economic ranking. See notes/reports/inv01-tsa23-gap-priority.md for the
score, top tiles, and tier tables.
Recommendation
Do not operationalize the current surface. Validate/refit with independent field plots and a true spatial holdout before spending the download/compute budget on the 907 tiles. If a coverage increment is needed, start with the 182 A tiles (49,250 ha VRI forest, 30,333 ha THLB) as a separate experiment. The 2,466 km2 with no selected public point cloud has no model surface.
Reproduction
The scripts are in examples/inv01_tsa23_validation:
vri_reconcile.pygap_priority.pymake_validation_figures.pypsp_holdout.pybuild_status_mask.pycompute_regional_features.pyfit_regional_candidate.pyhigh-biomass refit runbook:
notes/reports/inv01-tsa23-high-biomass-refit.md